Thursday, August 15, 2013

Can demography explain Portugal's slump before the crash? Is the Eurozone suffering from a “Shortage of Japanese”?

In Portugal, unlike other countries now experiencing economic difficulties in the Eurozone - Spain, Greece and Ireland-, anemic economic growth was all too evident before the financial crisis of 2007-08.  Accession to the Euro club brought a significant reduction in interest rates in those countries that had maintained historically high interest rates, which triggered real estate bubbles - Ireland and Spain, and public overspending - Greece, allowing these countries to maintain rates of economic growth above the European average. In Portugal, who suffered not only a mild housing bubble but also from government overspending,  growth was much weaker than the group mentioned above and more in line with countries that  have had lacklustre performances in the European context: Germany; Italy. (See chart below)


What’s the reason for the low growth relatively to other countries that are now in the same situation? To put another way, what’s the cause that differentiated Portugal from the other countries before the crisis of 2007-08, and how it faded since? Some recent papers and articles attempt to explain the causes of this relative weak performance, but although some of the causes advanced can in part explain the weak growth in Portugal, they do not fully explain the low growth relatively to the group mentioned above because many of the issues were also present in the other countries before the crisis.

Long term economic growth can be split into labor force growth and productivity growth.  Invariably, the main cause cited for the Portuguese low growth has been productivity growth, or the lack of it, but although this certainly has been a problem in the last decade, not so much before, it hardly appears enough to explain the relative week performance. The differences in productivity gains don't seem big enough to justify the differences in GDP growth, even in the cases of Ireland and Greece, countries where productivity growth was higher than Portugal; but certainly this is true for Spain as its productivity growth was smaller than Portugal, as can be seen in the chart below. In the last decade, productivity growth in Portugal was threefold that of Spain but its growth was less than half. 


As such, we can safely conclude, that productivity on its own cannot explain the differences in economic growth between Portugal and the other group of countries. On the other hand, the stagnation and decline of the working-age population can not only explain the weak economic growth that afflicted Portugal, but also the GDP growth differences between several countries in the Eurozone before the crises.


As explained in the previous post, between 2003 and 2008, working-age population growth in Portugal was negligible and as such the “workforce effect” - contribution of labor force growth to GDP growth - was non-existent, as can be seen in the chart above.  Starting in 2008, working-age population growth became negative and thus the “workforce effect” began to act as drag on the economy. To maintain a healthy economic growth Portugal had to gradually increase its productivity growth, and/or alternatively increase its labor participation rates - to compensate for the declining workforce-, but this is not easily attainable, as such, trend growth will surely steadily fall. Therefore, when the labor force starts to stagnate or decline, economic growth stalls. This explains the weak economic growth in several European countries in the last decade. In particular, it explains why Portugal and Spain had very different economic performances before the 2007-08 financial crises and how this began to converge after this. 

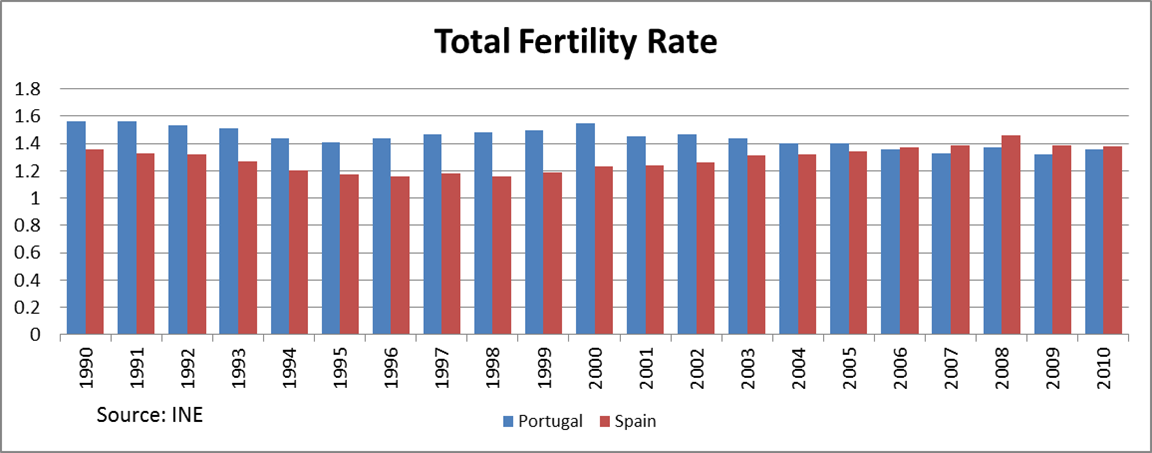
Population change is comprised of natural growth, the difference between births and deaths, and net migration, the difference between immigration and emigration. Natural growth, both for Portugal and Spain, had been barely edging positive in the turn of the century since in both countries the total fertility rate fell below replacement level in the early 80’s. In Portugal, natural growth turned negative in 2007, the year that for the first time there were more deaths than births. On the contrary, Spain experienced a slight recover of its natural growth in recent years, as a result of an increase in its total fertility rate, as can be seen in the chart below, although this is due almost exclusively to foreigners, who have a higher fertility rate than the native-born.


As a result, both in Portugal and Spain, population growth in the last decades depended almost exclusively on having a positive net migration, and this resulted in a large influx of immigrants. But while in Portugal this growth began to slow down since 2002, in Spain immigration exploded until 2007, as can be seen in the chart below. "No modern country on Earth experienced such a massive increase in its immigrant population as Spain. In 1990, one in 50 people in Spain was an immigrant. Today, it's one in seven."


Portugal not only received fewer emigrants from 2000 onwards, but also witnesses a massive exodus of its nationals.  As Edward Hugh pointed out, the entry in the European Union was accompanied by steady emigration flows, which clearly sets Portugal apart from the other countries, Spain in particular (see map on page 11), and resembles more the path that would be later trodden by Eastern Europeans countries when of their accession to the European Union.  Consequently, and according to the Instituto Nacional de Estatística (Statistics Portugal), during the inter-census period, the resident population of Portugal increased by only 1.9% while in Spain, the increase was 12.9%. (Chart below)


With the accession to the European Monetary System and later the Euro, interest rates declined significantly for both Portugal and Spain and as a result the two increased their debt levels. According to the McKinsey report, Debt and deleveraging (see page 14), in the second quarter of 2011 Portugal and Spain had total debt of 356 and 363 (as % of GDP), respectively. The consequence of cheap and easy credit was to create a housing bubble, both in Portugal and in Spain, but while the Portuguese began to deflate in 2002, the Spanish continued to inflate until 2008. This outcome was the result of the substantial increase in Spain’s population as a result of immigration, many of them Portuguese, while the increase in immigration in Portugal was just enough to replace the ones who were leaving. This population growth allowed the housing bubble to continue for much longer in Spain, while in Portugal there were no longer enough people to buy the excess homes being built, and so prices didn't skyrocket; but the housing units were built regardless. As such, rather than a classical bubble with inflated house prices, in Portugal, it was more a case of oversupply, given that 800,000 homes were built in the last decade while the population only grew by 200,000. On the contrary, in Spain, in addition to the excess construction, prices went through the roof, with immigration having a great influence on both. It is estimated that the immigration inflow increased house prices by about 52% and was responsible for 37% of the total construction of new housing units between 1998 and 2008From 2002 until the 2007-08 financial crises, the growth of the Portuguese economy began to be more in line with the growth of economies where the labor force was stagnant or declining, namely Italy and Germany, as can be seen in the chart below.


The chart above is easier to understand if we group countries into two groups: countries with weak economic growth – Portugal, Germany and Italy-, and countries with more healthy growth - Spain, Ireland and Greece.  With the exception of Greece, countries with sound economic growth before the recession were also the countries with higher labor force growth in the same period, as shown in the graph below.  By contrast, in countries where economic growth was weaker, the labor force growth was also more moderate or even negative, as in Germany. (Chart below)


However, the dynamics changed completely with the onset of the 2007-08 recession. In Spain, where working-age population growth depended exclusively on immigration, the rates of labor growth collapsed, only matched by the plunge of its GDP growth, and its workforce has actually started to shrink. In Ireland, despite a more abrupt fall, growth nonetheless remained positive, this was due to the fact that its population growth did not depend only on net migration but had an important natural component as well.  In fact, Ireland has the highest fertility rate amongst European countries and therefore, unless immigration returns to numbers only seen in previous centuries, growth of its working-age population should stabilize in positive territory, although at a level well below the pre-crisis.

In Portugal and Greece, even before the 2007-08 recession, the labor force growth already showed clear signs of a slowdown, as growth came to a standstill in 2005, and despite a slight recovery after, more pronounced in Greece than Portugal, working-age population went into decline with the onset of the recession.  Italy, which had reversed the decline of its working-age population initiated in the 90’s, appears once again to slide back into negative territory. On the other hand, in Germany, the workforce began to grow for the first time since 1998 due to an increase in immigration, many of them Portuguese, Spanish, Italian and Greek.

As explained by Daniel Gros, when comparing economic growth performance between countries with very different rates of population growth, the best indicator is undoubtedly GDP per Working Age Person (GDP/WAP).


Hence, if we compare the per working-age person GDP growth between the various countries in the last decade, as such taking working-age population growth out of the equation, it can be said that neither the growth of Spain and Ireland was so spectacular, nor the growth of Portugal, Germany and Italy fared so badly in comparison. In fact, only Greece seems to have had a spectacular growth, which would be in line with its productivity growth before the recession, but Greece’s population statistics might be underestimated, as Greece has not only a large population of illegal immigrants but some weakness in data collection have also been highlighted. Anyway, its growth was probably due to other unrepeatable factors, such as the Olympic Games. It also should be highlighted the economic growth achieved by Germany despite the decline of its workforce, proving that growth is possible with a declining population.


Despite some regional variations as a result of internal migrations, the reality is that working-age population in the Eurozone as a whole has initiate a long downward trend that will have major repercussions in terms of its economic growth, as explained in the previous post, and therefore, we can also conclude that Europe suffers from a "shortage of Japanese" as shown in the graph below.


As such we cannot fully comprehend the situation that Portugal, Spain and Greece face at the moment without looking into their adverse demographics.  This already exerted an disproportional role in the last decade, namely in Spain,  whose working-age population growth  goes a long way explaining its outstanding economic growth, while for Portugal the contrary it’s true, as the lack of population growth made its economy  lose steam  as it joined the Euro. More worryingly tough, is that working-age population in Europe as a whole has started a long, perhaps irreversible, path of decline that will act as a drag on its economic growth, making the economic recovery for these countries even more difficult.

Monday, May 13, 2013

Is Portugal Facing a “Shortage Of Japanese"?

So, about the slow growth/debt connection: I’ve done a quick and dirty mini-RR for the period 1950-2007 ……focusing only on the G7……and if you look at it, you see that most of the apparent relationship is coming from Italy and Japan……And it’s quite clear from the history that both Italy and (especially) Japan ran up high debts as a consequence of their growth slowdowns, not the other way around.” – Paul Krugman, Reinhart-Rogoff, Continued


Despite so much intense debate about the ailment from which Portugal suffers, and the mountain of sacrifices currently being borne by the Portuguese people one fact has gone virtually unnoticed in amongst all the noise - for the first time, at least in the modern era, Portugal’s working age population has started to shrink. Demography and its possible impact on economic growth is a topic which has been largely ignored by practitioners of economic science in recent decades as population growth has by-and-large been on an upward trend. However, as we enter a new period in human history, one in which the upward trend has shifted towards stagnation or even in some cases towards long run decline, the economic and financial implications of this transformation can no longer be ignored. As Nobel economist Paul Krugman indicates in the above quote, some countries have large debt simply because they have low growth.

So what is the common thread that runs through these low-growth high-debt countries? Could it be decelerating labour force growth and eventual labour force contraction? The cases of Italy and Japan are well known. In the case of Portugal, it will be argued here, demographic trends can not only explain a significant part of the slow economic growth the country experienced during the first decade of this century, they can also help us understand the depth of the current recession. More important still, we need to think about the consequences of this continuing lose-lose dynamic for the country’s future in both the short and much longer term.

Economists didn’t always take the view that population dynamics were irrelevant to economic performance. The 1930s gave birth to a serious debate about the possible problem that would arise if many decades of strong population growth were followed by population stagnation and then decline, a debate which was provoked by the fact that birthrates in a number of countries fell below replacement level for the first time in human history during the economic depression. And among the names of those economists who took the problem seriously enough to think and write about it was none other than John Maynard Keynes.

There are, indeed, several important social consequences already predictable as a result of a rise in population being changed into a decline. But my object this evening is to deal, in particular, with one outstanding economic consequence of this impending change; if, that is to say, I can, for a moment, persuade you sufficiently to depart from the established conventions of your mind as to accept the idea that the future will differ from the past.” J.M. Keynes, Eugen Rev. 1937 April; 29(1): 13–17.

While the phenomenon has arrived largely unnoticed Portugal’s total population has long been near to stationary.


As can be seen in the above chart, Portugal’s population has been struggling to find growth momentum since the mid 1980’s (the first time numbers actually dipped downwards) but the years 2010/2011 seem to mark a more fundamental turning point, since it was in that time interval that Portugal’s population started on a long, and possibly irreversible, path of decline. Having long had a total fertility rate of below 1.5 this was a more than predictable outcome, and one that should have been expected ever since the total fertility rate fell (and stayed) below the 2.1 replacement level in 1982.


As is well known, population change is comprised of two major components: natural growth and net migration. Natural growth, births minus deaths, became negative in 2007 and thereafter population growth has become exclusively dependent on having sufficient positive net migration. Up to 2010 this condition was satisfied given the continuing influx of immigrants into the country as can be seen in the chart below.


However, since the onset of the 2008 recession, not only have the immigration flows reversed completely, but emigration has started to increase again, thus reanimating a trend that has been constantly present in Portuguese history over decades, even centuries. This is perhaps the most critical factor driving the recent population decline. In fact the decline would have occurred much earlier had it not been for the return of thousands of refugees from the Portuguese colonies in the 1974-1981 period.


According to the European Commission's 2012 Ageing Report, projections for the Portuguese population during the period 2010 - 2060 anticipated that population would peak in 2034, but as we have seen, the latest data show the population unexpectedly reached its peak in 2010 (total population, previous chart), the year in which the population began to decrease (a similar phenomenon seems to have occurred in Spain in 2012, with again a reversal in migrant flows in an otherwise stagnant population being the trigger). This fact that this turnaround comes as a surprise is clearly the result over optimistic assumptions on the net migration front since the numbers for natural growth are well known and change little (although birth numbers are now dropping in many EU countries under the impact of the long recession). Clearly the unexpected factor here is the severity of the recession from which the country is suffering and the size of the exodus of young people who are leaving.

Just to highlight even more the speed with which all this is happening, in Japan, the interval between the beginning of the decline of the working age population and the beginning of total population decline was a full decade. In Portugal this interval was only two years.

Even more relevant than the decline in total population for the purpose of the present discussion is the decline in the working-age population. While the former gives us a good proxy for domestic consumption, it is the later which is important in terms of potential national output. All other things being equal a reduction in the working-age population means a reduction in output. Therefore, the most important detail to catch from the chart above is that the working-age population, defined as the population with ages ranging from 15-64, declined for the first time in Portugal between 2008 and 2009. As highlighted by both Daniel Gros and Paul Krugman if you want to compare economic growth performance as between countries with growing populations and those with declining ones the best indicator to use is undoubtedly GDP per Working Age Person (GDP/WAP).

In the Portuguese case if we take this ratio and compare it with both Real GDP growth and Working Age Population change (my calculations VM), we can get an impression of how variations in the Working Age Population affect the economic growth of a country. Surprisingly or otherwise, the data for Portugal viewed graphically not only confirms the existence of the “workforce effect” – the relationship seen between Real GDP and GDP/WAP - but also suggests that Portugal has already passed the point where this effect is beginning to have a negative impact on GDP growth.


As can be seen in the above chart, until 2008 the growth rate of Real GDP was always higher than the rate for GDP/WAP offering a strong suggestion that labour force growth was having a positive impact on GDP growth. It is noteworthy, however, that both in the period 1986 - 1991 and in the period 2003 - 2008, the growth rates of Real GDP and GDP/WAP almost overlapped. This phenomenon coincided with very low or zero rates of working age population growth and as such the “workforce effect” was mostly neutral. The first of these periods, 1986 - 1991, the stagnation in the workforce was the direct result of the increase in emigration that followed the entry of Portugal in the European Union. The second one coincides with the arrival of the turning point in long term WAP growth, as the size of the working age population irrevocably turns negative.

Indeed, during this early period of emigration towards the EU Portugal’s total population decreased, as shown in the chart Population by age group (above, blue line), but at the time, since the population in general was much younger, and many more new labour force entrants were arriving at working age, the growth rate of the workforce remained slightly positive. In other words, there were still enough Portuguese entering the labour market to replace those who were leaving it (either to retire or to seek a future abroad). In the second period, 2003 - 2008, the large exit of Portuguese nationals, about 700,000 between 1998 and 2008 according to research by the now Economy and Employment Minister Álvaro Santos Pereira, was to some extent offset by an inflow of immigrants, but these were only sufficient in number to maintain the workforce at a stationary level.

All this calm and stability disappeared, however, after 2008 when the growth rate of Working Age Population turned negative, i.e. the labour force began to decline (see graph below). Where the growth rates of Real GDP and GDP/WAP overlap we can surmise that working age population change is having no effect on real GDP growth. Subsequently, however, the growth rate of GDP/WAP becomes higher than the growth rate of Real GDP and thus the "workforce effect” starts to act as a drag on the economy steadily bringing the potential overall growth rate down. In other words, Portugal is now suffering from a "Shortage of Japanese" as Edward Hugh has called the phenomenon, after Paul Krugman originally coined the term to describe the underlying problem which has been afflicting the Japanese economy since the mid-1990s.


The fact that the three lines in the above chart happen to intersect at zero is perhaps just an unfortunate coincidence but is consequences are disastrous, since the downward trend that was already evident accelerated greatly after the onset of the recession. The resulting rise in unemployment not only caused a collapse in the immigration flow, it also led to a sharp increase in emigration. As a result workforce shrinkage intensified even further, as can be seen in the above chart by looking at the growing distance between the Real GDP and the GDP/WAP lines. That is, if the workforce had remained stationary the economy would be growing at similar rates to the GDP/WAP, i.e. above the current level as indeed happened in the period 2003 – 2008.

Naturally, the argument can be advanced here that the recession is a cyclical phenomenon, and this is surely true, there is an ongoing cycle, but the argument being used refers to long term trends – a reversal in direction (or change of sign) for inputs from the labour force component brings down the overall trend growth rate making booms weaker and recessions deeper, all other things being equal. This would seem to be a simple conclusion which stems from elementary growth accounting theory. Naturally, there are other factors which contribute to growth, like multi factor productivity, but again other things being equal you would need more of this to achieve the same growth rate as before under conditions of weakening in the labour force growth component.

Thus the argument is not that economic growth becomes impossible with a stagnant or slowly declining workforce, but simply that it becomes harder to achieve because it relies more on other factors, such as productivity and raising participation rates, but these change slowly over time, and more so in already developed countries. As such trend growth will surely steadily fall. This can be clearly seen in the following chart: while workforce growth was an important source of growth when Portugal was a developing country, its importance fell back as the workforce started to stagnate even as Portugal was approaching converge with other developed countries in terms of productivity. Other factors took over and increased their importance steadily as the economy started to converge with more advanced ones. Now that this catch up process seems to have come to a standstill as well the economy simply can’t growth, at least at rates considered normal. With a stagnant workforce, low growth or no growth is the new normal.


Following standard growth accounting procedures, during the 1970s workforce growth accounted for more than half of Portuguese economic growth (see chart above, my calculations VM), and this contribution had fallen to only 16% in the first decade of this century. However, since 2008 not only has this contribution reversed sign but also the magnitude of the negative effect has begun to increase rapidly. Such that, by 2011 the “workforce effect” could be considered to explain more than 29% of the GDP decline. This “negative drag” will continue, and the effect possibly become greater, as the working age population shrinks further. Had the workforce remained stationary we could surmise the 2010 recovery would have been more pronounced and the 2011 recession wouldn’t have been so deep. This is the principal reason why official growth forecasts have been being constantly revised to the downside, and this will continue to happen until the models the forecasters use adequately incorporate the effects of population decline on economic growth. Adding insult to injury, ignorance of the existence of such effects recently led Portugal’s Prime Minister Pedro Passos Coelho to suggested young unemployed Portuguese resort to emigration as an escape route from the crisis, advice thousands have now followed thus making a bad situation even worse.


Economic growth in Portugal appears to be on a long downward trend, a trend which will only be made worse by the onset of the decline in its working age population. Economic output is now at 2001 levels and thus we can now conclude that the last decade has been completely lost. More worryingly though, is that after such a bad start to this decade, it might not be unreasonable to conclude that this one is also in the process of being lost too.

At best the economy will stagnate in the years to come but the possibility is there that it will continue to regress – especially if nothing is done to stem the outflow of young educated people - and by 2019 it might even be back somewhere in the 1990’s. This is scenario simply cannot be excluded since, in addition to all the other problems the country faces, a situation that would be in any circumstance challenging is now being aggravated by one more variable whose contribution cannot be easily reversed in the short term – the decrease in the working age population. More than the fact in itself, it is the speed at which this is happening which is alarming, and the fact that policymakers appear unaware of the problem. In analyzing the low Portuguese economic growth issue the decrease in the country’s working age population can no longer be ignored! Or at least it is hoped that this will be one of the outcomes of this short report.

To return to where we started, Keynes concluded in his pioneering presentation that a stationary or slowly declining population could increase its standard of life while preserving the institutions society values most if, and only if, the process was managed with the necessary strength and wisdom. On the contrary, he argued, a rapid decline in population, of the kind that we are seeing in Portugal today, would almost inevitably result in a serious decline in living standards and a breakdown in highly valued social security mechanisms. The distinction Keynes drew some 80 years ago between rapid and managed rates of decline seems plausible, reasonable and highly relevant today. What we now need to see are urgent measures taken – initiated by the EU and the IMF - to counter the exodus which lies behind this dramatic decline which is occurring before our eyes, measures which at least try to decrease its speed, because once a process like this gains full velocity it will be very difficult to stop, and we have already seen it gather considerable traction. Ireland is a pointer and a great example to learn from, since it took that country more than a century to recover the population decline precipitated by the Great Famine which hit the country in the middle of the nineteenth century.